
[[link]]) and standard markdown links, making it easy to understand your documentation structure at a glance.
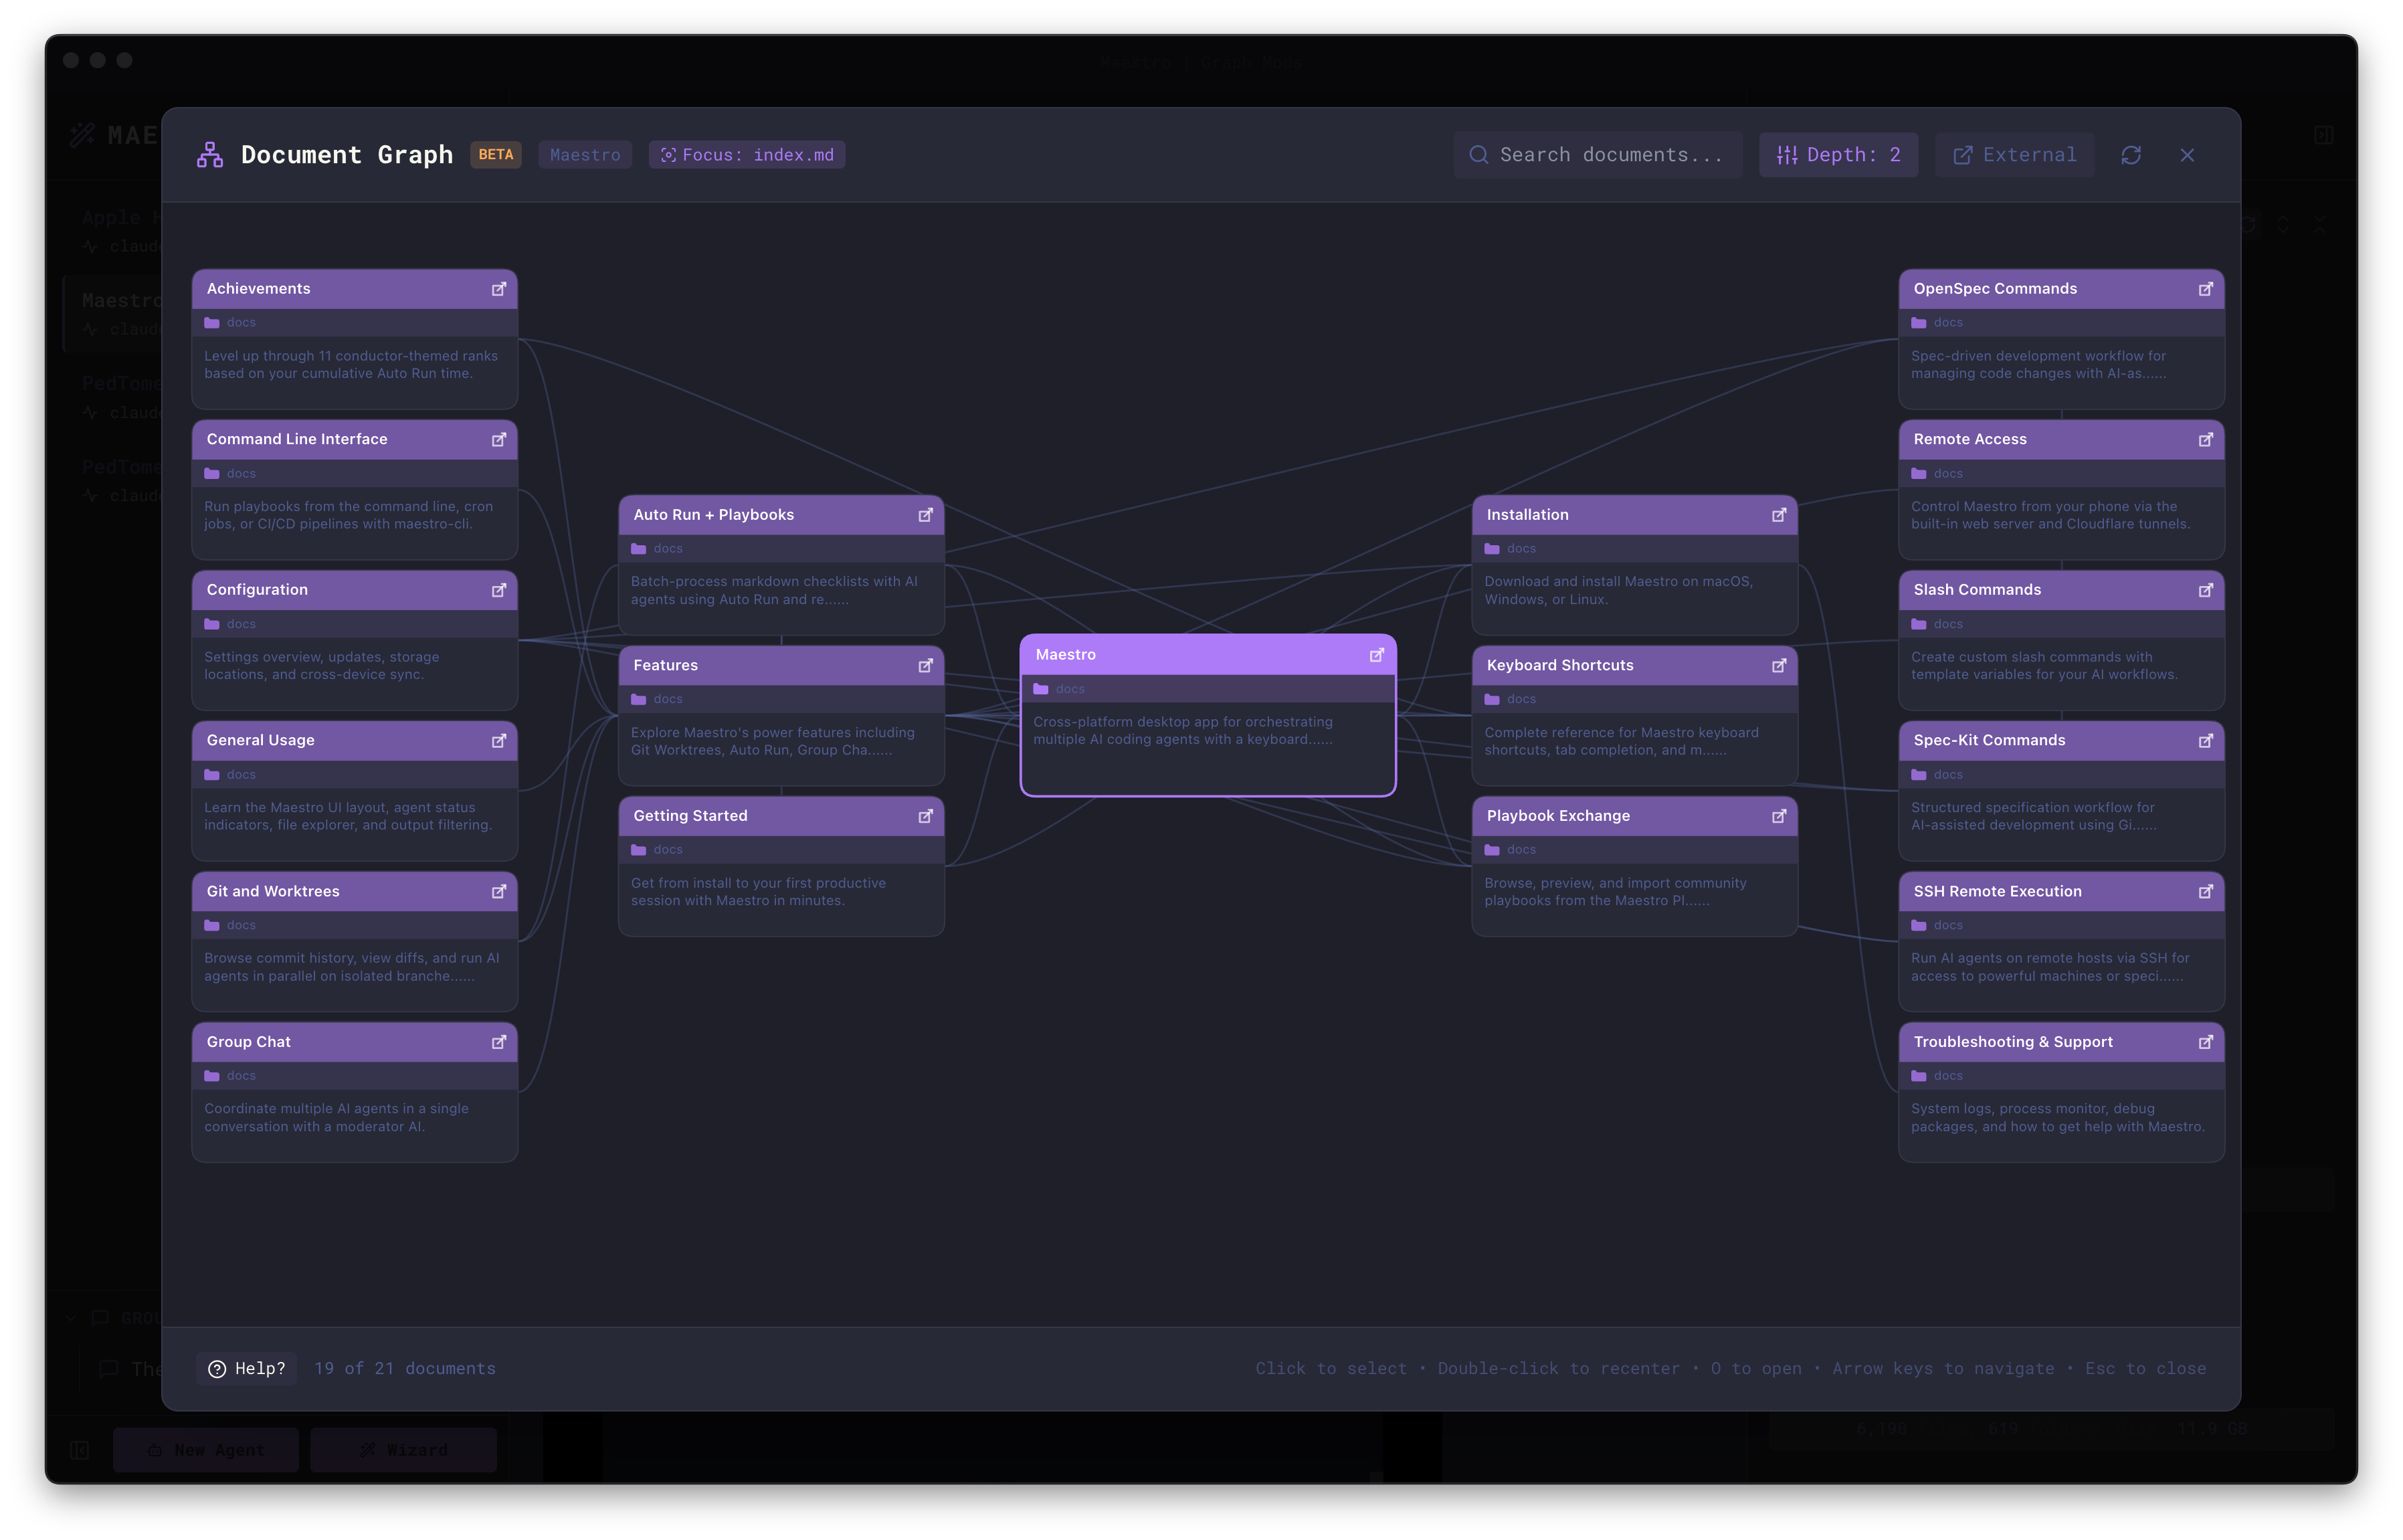
Opening the Document Graph
There are several ways to access the Document Graph:From File Preview
When viewing a markdown file in File Preview, click the graph button in the preview toolbar to open the Document Graph focused on that file. PressEsc to return to the File Preview. This is the primary way to open the Document Graph.
From Quick Actions
PressCmd+K / Ctrl+K and search for “View in Document Graph” to focus the graph on the markdown file you are previewing, or “Open Last Document Graph” to re-open the most recently viewed graph.
The “Open Last Document Graph” option only appears after you’ve opened a Document Graph at least once during your session.
From the File Explorer
After you’ve opened a Document Graph at least once, a graph icon (branch icon) appears in the Files tab header. Click it to re-open the last viewed graph.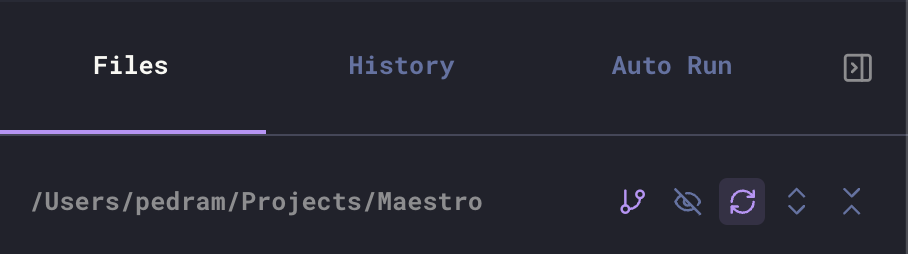
From File Context Menu
Right-click any markdown file in the File Explorer and select Document Graph to open the graph focused on that file.From a Folder or a Selection
Right-click a folder and choose Open in Document Graph to graph every markdown file beneath it. Or select several markdown files (Cmd/Ctrl+click,
or Shift+click for a range), right-click, and choose Open N in Document
Graph.
These open a scoped graph, which answers a different question from the
single-file graph. A single-file graph walks outward from one document and can
only ever show what that document reaches. A scoped graph shows exactly the
files you picked - including the ones that link to nothing, which is the only
way an unlinked document is visible at all. Links pointing outside the scope
stay broken rather than dragging their targets in.
The center is picked automatically: whichever document in the scope has the most
links. Right-click a specific file inside a selection to center on that one
instead.
From the Command Line
Using Go to File
PressCmd+G / Ctrl+G to open the fuzzy file finder and navigate to any markdown file, then use the preview toolbar’s graph button (or Cmd+K and “View in Document Graph”) to jump to the Document Graph from there.
Navigating the Graph
The Document Graph is designed for keyboard-first navigation:L steps through Mind Map, Radial, Hierarchical, Force, Lobes, and Timeline, in the same order as the layout dropdown. D widens the depth one level per press (1 through 5, then All, then back to 1). P steps the preview length through Off, 50, 100, 200, 350, and 500 characters. F re-frames the whole graph, and S switches what the scroll wheel does.
Esc steps back out one level at a time rather than closing outright. It closes the help panel first if that is open, then it takes you out of the search box with your query intact, which is the point: search, Esc, then arrow to a hit while the matches are still highlighted. Press it again to clear the search, and once more to close the graph.
Closing asks for confirmation first, since Esc would otherwise discard the layout, depth, and node positions you set up. Turn that prompt off in Settings → Display → Document Graph. A graph opened from the Memories viewer never asks either way: Esc hands you straight back to that viewer, so there is nothing to lose.
Mouse Controls
- Click a node to select it
- Double-click a node to recenter the view on it
- Drag nodes to reposition them
- Scroll to zoom in and out, or to pan - see Scroll Mode
- Shift+Scroll to do whichever of those two the plain wheel is not doing
- Pan by dragging the background
- Mini-map in the bottom-left corner shows the whole graph; click or drag on it to jump the main view to that spot
- Drag the left edge of the in-graph document preview to make it wider or narrower; the width is remembered. Double-click that edge to restore the default.
Graph Controls
The toolbar at the top of the Document Graph provides several options:Depth Control
Adjust the Depth slider to control how many levels of connections are shown from the focused document:- Depth: 0 (All) - Show all connected documents regardless of distance
- Depth: 1 - Show only direct connections
- Depth: 2 - Show connections and their connections (default)
- Depth: 3-5 - Show deeper relationship chains
D to widen it one level per press without opening the slider.
Layout
The layout dropdown switches how nodes are arranged. PressL to step
through them in the order below. Switching layouts clears any nodes you
dragged, since those positions belong to the layout they were set in.
Lobes
Lobes groups documents by which other documents they link to, using community detection over the link structure rather than by folder or by name. Each group is drawn as a coloured blob with the number of documents in it, and every node takes its group’s colour on its border so membership is readable without tracing the outline. This answers a question the ring layouts throw away. In a collection built around one hub document, nearly everything sits one or two links from the center, so Radial draws two enormous rings and Hierarchical draws two rows - correct, but they say nothing about which documents belong together. Documents that link to nothing else on screen are gathered into a single dashed, muted Ungrouped blob rather than being scattered as one-node groups of their own. They are the leftovers, not a finding, so they are drawn to stay out of the way of the real groups. Lobes needs more room than Force for the same documents, because separating groups costs space. PressF to fit it on screen.
Timeline
Timeline puts one column per day that has documents, oldest on the left, captioned with the date. Columns are evenly spaced by order rather than by real elapsed time: a collection written in bursts would otherwise be two dense clumps with a screen of empty canvas between them. Documents whose modification time could not be read - which can happen over an SSH remote - collect in a leading Undated column instead of being dated to 1970 and sorted first. Unlike every other layout, Timeline places unlinked documents in the columns alongside everything else rather than in a band below the graph. An unlinked document still has a date, and when it was written is exactly the question this layout answers.Scroll Mode
The Scroll pill switches what the mouse wheel does, as does pressingS or
the toggle inside the Help panel:
- Zoom (the default) - the wheel zooms toward the cursor, and
Shift+wheel pans the canvas. - Pan - the wheel pans in both directions, and
Shift+wheel zooms.
Shift always reaches the other action, so neither is
ever more than a key away. The choice is remembered between visits.
Preview Length
The Preview slider sets how much of each document’s opening text is drawn inside its node, from 0 up to 500 characters. PressP to step through Off, 50, 100, 200, 350, and 500 without opening the slider.
At Off a document is drawn as a filename pill - no body box, no preview text, no folder path. That is the densest reading of a large graph: many more nodes fit on screen at once, and the shape of the link structure is what you see instead of the content. Raise the limit again when you want to read what a document is about without opening it.
External Links
Toggle External to show or hide external URL links found in your documents:- Enabled - External links appear as separate domain nodes (e.g., “github.com”, “docs.example.com”)
- Disabled - Only internal document relationships are shown
Unlinked Documents
In a scoped graph, an Unlinked N button appears whenever some of the scoped documents connect to nothing else in the scope. They are drawn in a band below the graph with a dashed amber border, and the button hides them. They are shown by default: the reason to graph a hand-picked set is usually to find out which of those documents stand alone, so hiding them would hide the answer. “Unlinked” covers two cases, both invisible from the center: a document with no links at all, and a small cluster that links only within itself. This button does not appear on a single-file graph, where an unreachable document never becomes a node in the first place.Search
Use the search box to filter documents by name. Matching documents are highlighted in the graph.Snapshot
The Snapshot button in the center of the footer, orC, takes a picture of the
graph exactly as it is on screen, preview pane included, and offers two things
to do with it:
- Copy to Clipboard - paste the image straight into another app.
- Save to Disk - pick a location and write a PNG.
Understanding the Graph
Node Types
- Document nodes - Your markdown files, showing the filename and a preview of content
- External link nodes - Domains of external URLs referenced in your documents
- Focused node - The currently selected document (highlighted with a different border)
- Grouped nodes - In the Lobes layout, a node’s border takes the colour of the group it belongs to. Selection, focus, and the unlinked warning all override it, since those describe the node itself rather than its group.
Edge Types
Lines between nodes represent different types of connections:- Wiki-links -
[[document-name]]style links - Markdown links -
[text](path/to/file.md)style links - External links - Links to URLs outside your project
Node Information
Each document node displays:- Filename - The document name
- Folder indicator - Shows the parent directory (e.g., “docs”)
- Content preview - A snippet of the document’s content
P around to Off), only the filename remains and each node is drawn as a compact pill.
Tips for Effective Use
Workflow Integration
- Use
Cmd+Gto quickly find a file - Open it in File Preview to read or edit
- Click the graph button in the preview toolbar to see its connections in the Document Graph
- Press
Oto open a connected document - Press
Escto return to File Preview
Large Documentation Sets
For projects with many markdown files:- Start with Depth: 1 to see immediate connections
- Increase depth gradually to explore relationships
- Press
Paround to Off so every document is a compact filename pill - many more fit on screen, and the link structure is what you see - Press
Fat any time to fit the whole graph in the window. The graph also fits itself when it opens and whenever you change layout or preview length - Press
Sfor Pan once the zoom is right, so scrolling moves the view instead of changing the scale - Use Search to find specific documents quickly
- Drag nodes to organize the view - positions persist
Understanding Documentation Structure
The Document Graph is especially useful for:- Auditing links - Find orphaned documents with no incoming links
- Understanding navigation - See how documents connect for readers
- Planning restructuring - Visualize the impact of moving or renaming files
- Onboarding - Help new team members understand documentation architecture
- Finding the natural groupings - Switch to Lobes to see which documents cluster with each other, which is often not how they are foldered
- Seeing what is stale - Switch to Timeline to read the collection by when each document was last written